Gender Pay Gap (GPG) at Suffolk Libraries IPS Ltd
Suffolk Libraries Gender Pay Gap - 2023 report
As an employer with over 250 staff, Suffolk Libraries is required by law to carry out Gender Pay reporting under the Equality Act 2010 (Gender Pay Gap Information) regulations 2017.
On 5 April 2023 Suffolk Libraries employed 313 permanent staff: 262 females and 51 males. The gender pay gap between men and women was 13.13% compared with 13.8% in 2022, 12.3% in 2021 and 15.7% in 2020.
The full details of our Gender Pay Gap reporting are shown below, and the following factors should be considered:
- Female staff represent 83.71 % of the total workforce (last year was 82.7%)
- Staff numbers have decreased from 336 last year to 313 this year
- Salary sacrifice schemes reduce the hourly rate paid to a member of staff. Over time more staff have switched to this method, of which 73 % are female (an increase on last year)
- As per reporting rules, any staff with unpaid leave are not included
- Most staff on the minimum rate of £10.42 per hour are female and this reduces the mean average amongst female staff as there are fewer male staff overall
- The median average shows the middle rate male and female staff is 13.59% which is an increase on last year.
Our Executive Leadership Team is fully committed to focusing on development opportunities across the organisation and especially on enabling all colleagues to fulfil their potential. For example through internal apprenticeships, career pathways and secondment opportunities.
We will continue to embed our inclusive recruitment framework to ensure our recruitment and selection processes are inclusive, equitable and mitigate exposure to bias in decision making. The People and Culture team will monitor recruitment activity to ensure they are inclusive, and will make every effort to ensure our recruitment literature contains gender neutral language.
We encourage everyone to use Gallup, our employee engagement survey and follow this up with local team meetings, so that we can hear the views of all our people.
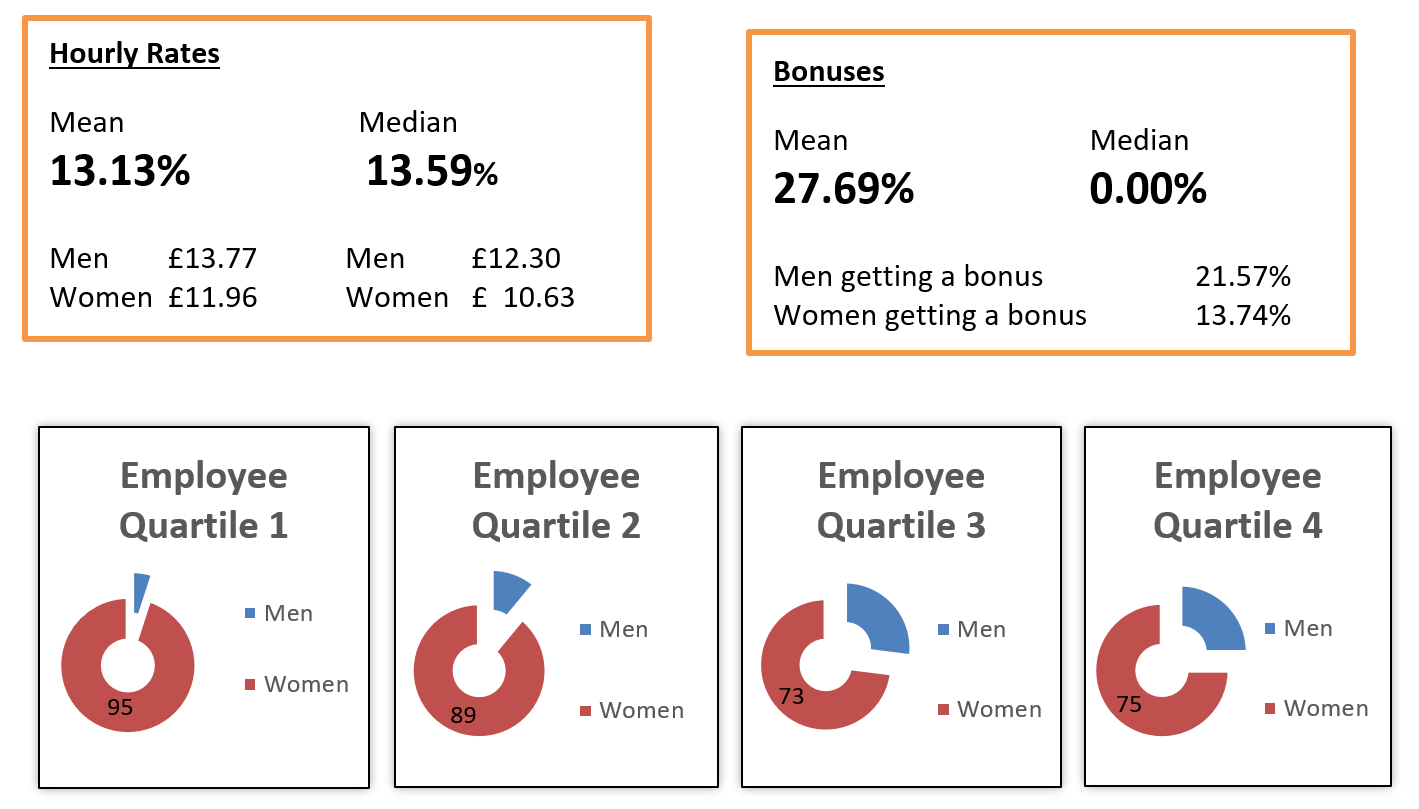
Note: Quartiles are calculated by dividing the workforce into four equal size groups and show the proportion of men (blue) and women (pink) in each quartile band, Quartile 1 being the lowest and 4 being the highest.